We human beings aren’t wired to detect slow and small changes. Only when the changes are drastic, it jumps out at us. This is an evolutionary handicap. Prof. Bakshi wrote a great blog on it here. I decided to apply this mental model to Bengaluru’s traffic woes.
Once upon a time, Bengaluru was a charming, quiet little town. Today, it is notorious for its traffic. Distances are measured in units of time and not in KMs. How did we get here from there?


See the table below. In 1976, Bengaluru had 674 vehicles per sq. KM. Today, it has 9,717 vehicles per sq. KM. That would mean a growth rate of 9% per year over 32 years.
My first reaction when I found a 9% growth rate per year was- that must be big enough for someone to catch it, right? So I double checked the stats and my calculation, turns out it is 9% alright. But if you calculate the growth rate per month (32 years = 384 months) and per day (32 years = 11680 days), the growth rates are really tiny (0.7% and 0.02% respectively).

That is, between 1976 and 2018, Bengaluru was adding 2 new vehicles for every 10,000 vehicles on road. Now, who would have caught that? But even small growth rates over long periods of time add up to something meaningful or something painful. Now this kind of blindness to slow and small changes does not afflict just you and me. It afflicts our city planners as well.
Lets take a second example.
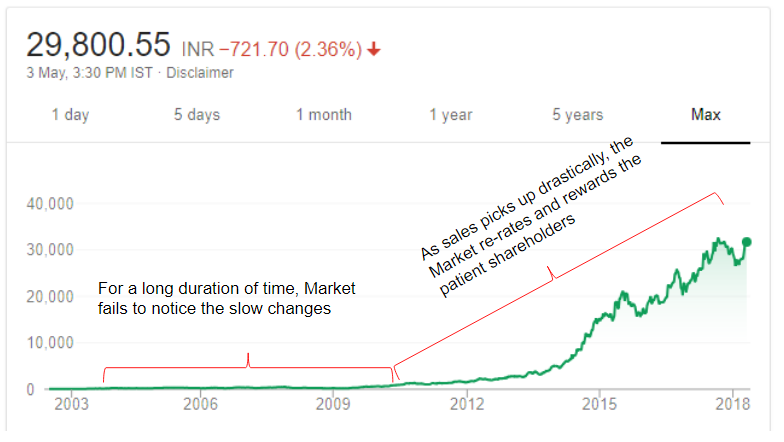
At the turn of the century, there was this manufacturing company which was selling a rather unique product. The product had a small following but outside the small fan base no one really cared for it. The company had a capacity of 4000 units and it could sell only about half of that. The parent company was considering a selloff or a closure. But as an experiment, around 2003 it started tinkering with the product quality and improved it gradually. For the next 7 years, it managed to increase the number of units sold by about 9% per year. But as we saw above, even 9% per year can be too small and too slow to notice.
Then, in the subsequent 7 years (between 2010 and 2017) it grew at the rate 43% per year; now that is too big a number to miss. And suddenly the product’s appeal grew beyond the traditional segment and many many more people started liking the product.

Like Bengaluru’s city planners, you and me, the stock market didn’t begin to take notice until the changes were more drastic. The product I am talking about is the Royal Enfield motorcycle.
So if city planners, you, me and the stock market are not equipped by evolution to notice small and slow changes in cities or businesses or what-have-you, what can we do? We can do what your pesky cousin from California does on his once-in-5 years-visit to Bengaluru. New buildings, new flyovers, new garbage piles that we seem to fail to notice everyday, all seem to jump at him.
Say we are analyzing a company and have the financial data for the past 10 years. Say, that pesky cousin visited you in the years of 2008, 2013 and a visit is impending next month. Assume he knows nothing about what happened in the intervening years. What would he say about the company’s business quality in those years (2008, 2013 and 2018)? Would he say its gone up drastically, significantly or has degraded? Things that may not seem obvious over 11 columns of excel suddenly become very obvious over 3 columns.
This approach also works while analyzing vehicle population, global warming, GDP, quality of life, weight loss or what-have-you. Compare the stats with at least 3 to years 5 gap and see what insights you can draw.
There may be other ways to overcome this evolutionary handicap. I would love to hear your workaround if you have one.
Sources of data:
- Vehicle population historical: https://bit.ly/2HS18R4
- Vehicle population in 2018: https://bit.ly/2rklxah
- Area of Bengaluru historical: https://bit.ly/2HLiUcx
- Area of Bengaluru in 2018: www.wikipedia.org
- Royal Enfield #s: http://www.eicher.in/investors-overview
Disclaimer: No position in Eicher Motors.

One thought on “An evolutionary handicap, Bengaluru’s traffic woes and a Product’s sales”